Market Framework
Markets Are Power-Law Machines
A point-in-time backtest of buying the biggest companies instead of the whole index.
7 June 2026 · YK Research
Contents
Executive Summary
This backtest asks one question: if the biggest companies capture most of the market's wealth creation, what happens if you buy only the biggest companies instead of the whole S&P 500?
The result is clear. A point-in-time basket of the largest companies beat SPY over 10 years, 20 years, and 30 years. The 30-year Top 10 basket compounded at 11.81% versus 10.18% for SPY. The Top 3 basket compounded at 12.95%.
The result is also dangerous. The Top 3 basket had a 67% drawdown. Concentration gave more upside, but it charged a high emotional and liquidity cost.
The Backtest
The test re-selects the biggest companies each month using historical market-cap data.
- Each month, rank US companies by market cap.
- Buy Top 3, Top 5, or Top 10.
- Equal-weight the selected names.
- Rebalance monthly.
- Compare against SPY and Berkshire Hathaway.
What It Is Measuring
This is a test of market concentration. It asks whether public equity wealth creation keeps flowing into the largest platforms and cash-flow machines.
- It uses historical market-cap ranks at each rebalance date.
- It is approximate US-company data, not official S&P constituent data.
- It uses adjusted prices for SPY and BRK-B.
- It ignores tax, turnover cost, slippage, and capacity.
Data and Methodology
Data Used
- Universe starts with the largest current US-listed companies from CompaniesMarketCap, plus manual additions for older giants such as GE, Exxon, Walmart, IBM, Cisco, Intel, Oracle, Citi, AIG, AT&T, Verizon, Coke, Pfizer, Merck, Home Depot, Chevron, Disney, Boeing, Altria, UPS, Ford, and GM.
- Historical market caps come from each company's CompaniesMarketCap market-cap history page.
- Daily adjusted prices come from Yahoo Finance. SPY and BRK-B are also Yahoo adjusted closes.
- The test uses US public-company market-cap rank, not official S&P 500 index membership.
Portfolio Construction
- At the start of each month, rank companies by latest available historical market cap.
- Select the Top 3, Top 5, or Top 10 names that also have tradable Yahoo price data.
- Equal-weight the basket at rebalance. A Top 5 basket starts each month at 20% per name.
- Hold those weights through the month, then repeat the ranking and rebalance process next month.
Return math
Daily basket return is the equal-weighted return of the selected names. The equity curve compounds those daily returns. CAGR, volatility, Sharpe with zero risk-free rate, and max drawdown are calculated from that curve.
Why equal-weight
Cap-weighted Top 5 would be dominated by the largest one or two names. Equal-weight makes the test cleaner: it asks whether the leadership group works, not whether one winner carried the whole result.
Main limitation
The universe is imperfect. Delisted and acquired former giants are undercovered. This makes the study directional research, not a CRSP-grade institutional backtest.
Results
10 Years
| Basket | CAGR | Max DD |
|---|---|---|
| Top 3 | 27.25% | -35.09% |
| Top 5 | 24.45% | -41.02% |
| Top 10 | 20.74% | -38.76% |
| SPY | 15.17% | -33.72% |
| BRK-B | 13.20% | -29.57% |
20 Years
| Basket | CAGR | Max DD |
|---|---|---|
| Top 3 | 16.72% | -49.38% |
| Top 5 | 14.74% | -48.68% |
| Top 10 | 13.58% | -46.52% |
| SPY | 11.28% | -55.19% |
| BRK-B | 11.02% | -53.86% |
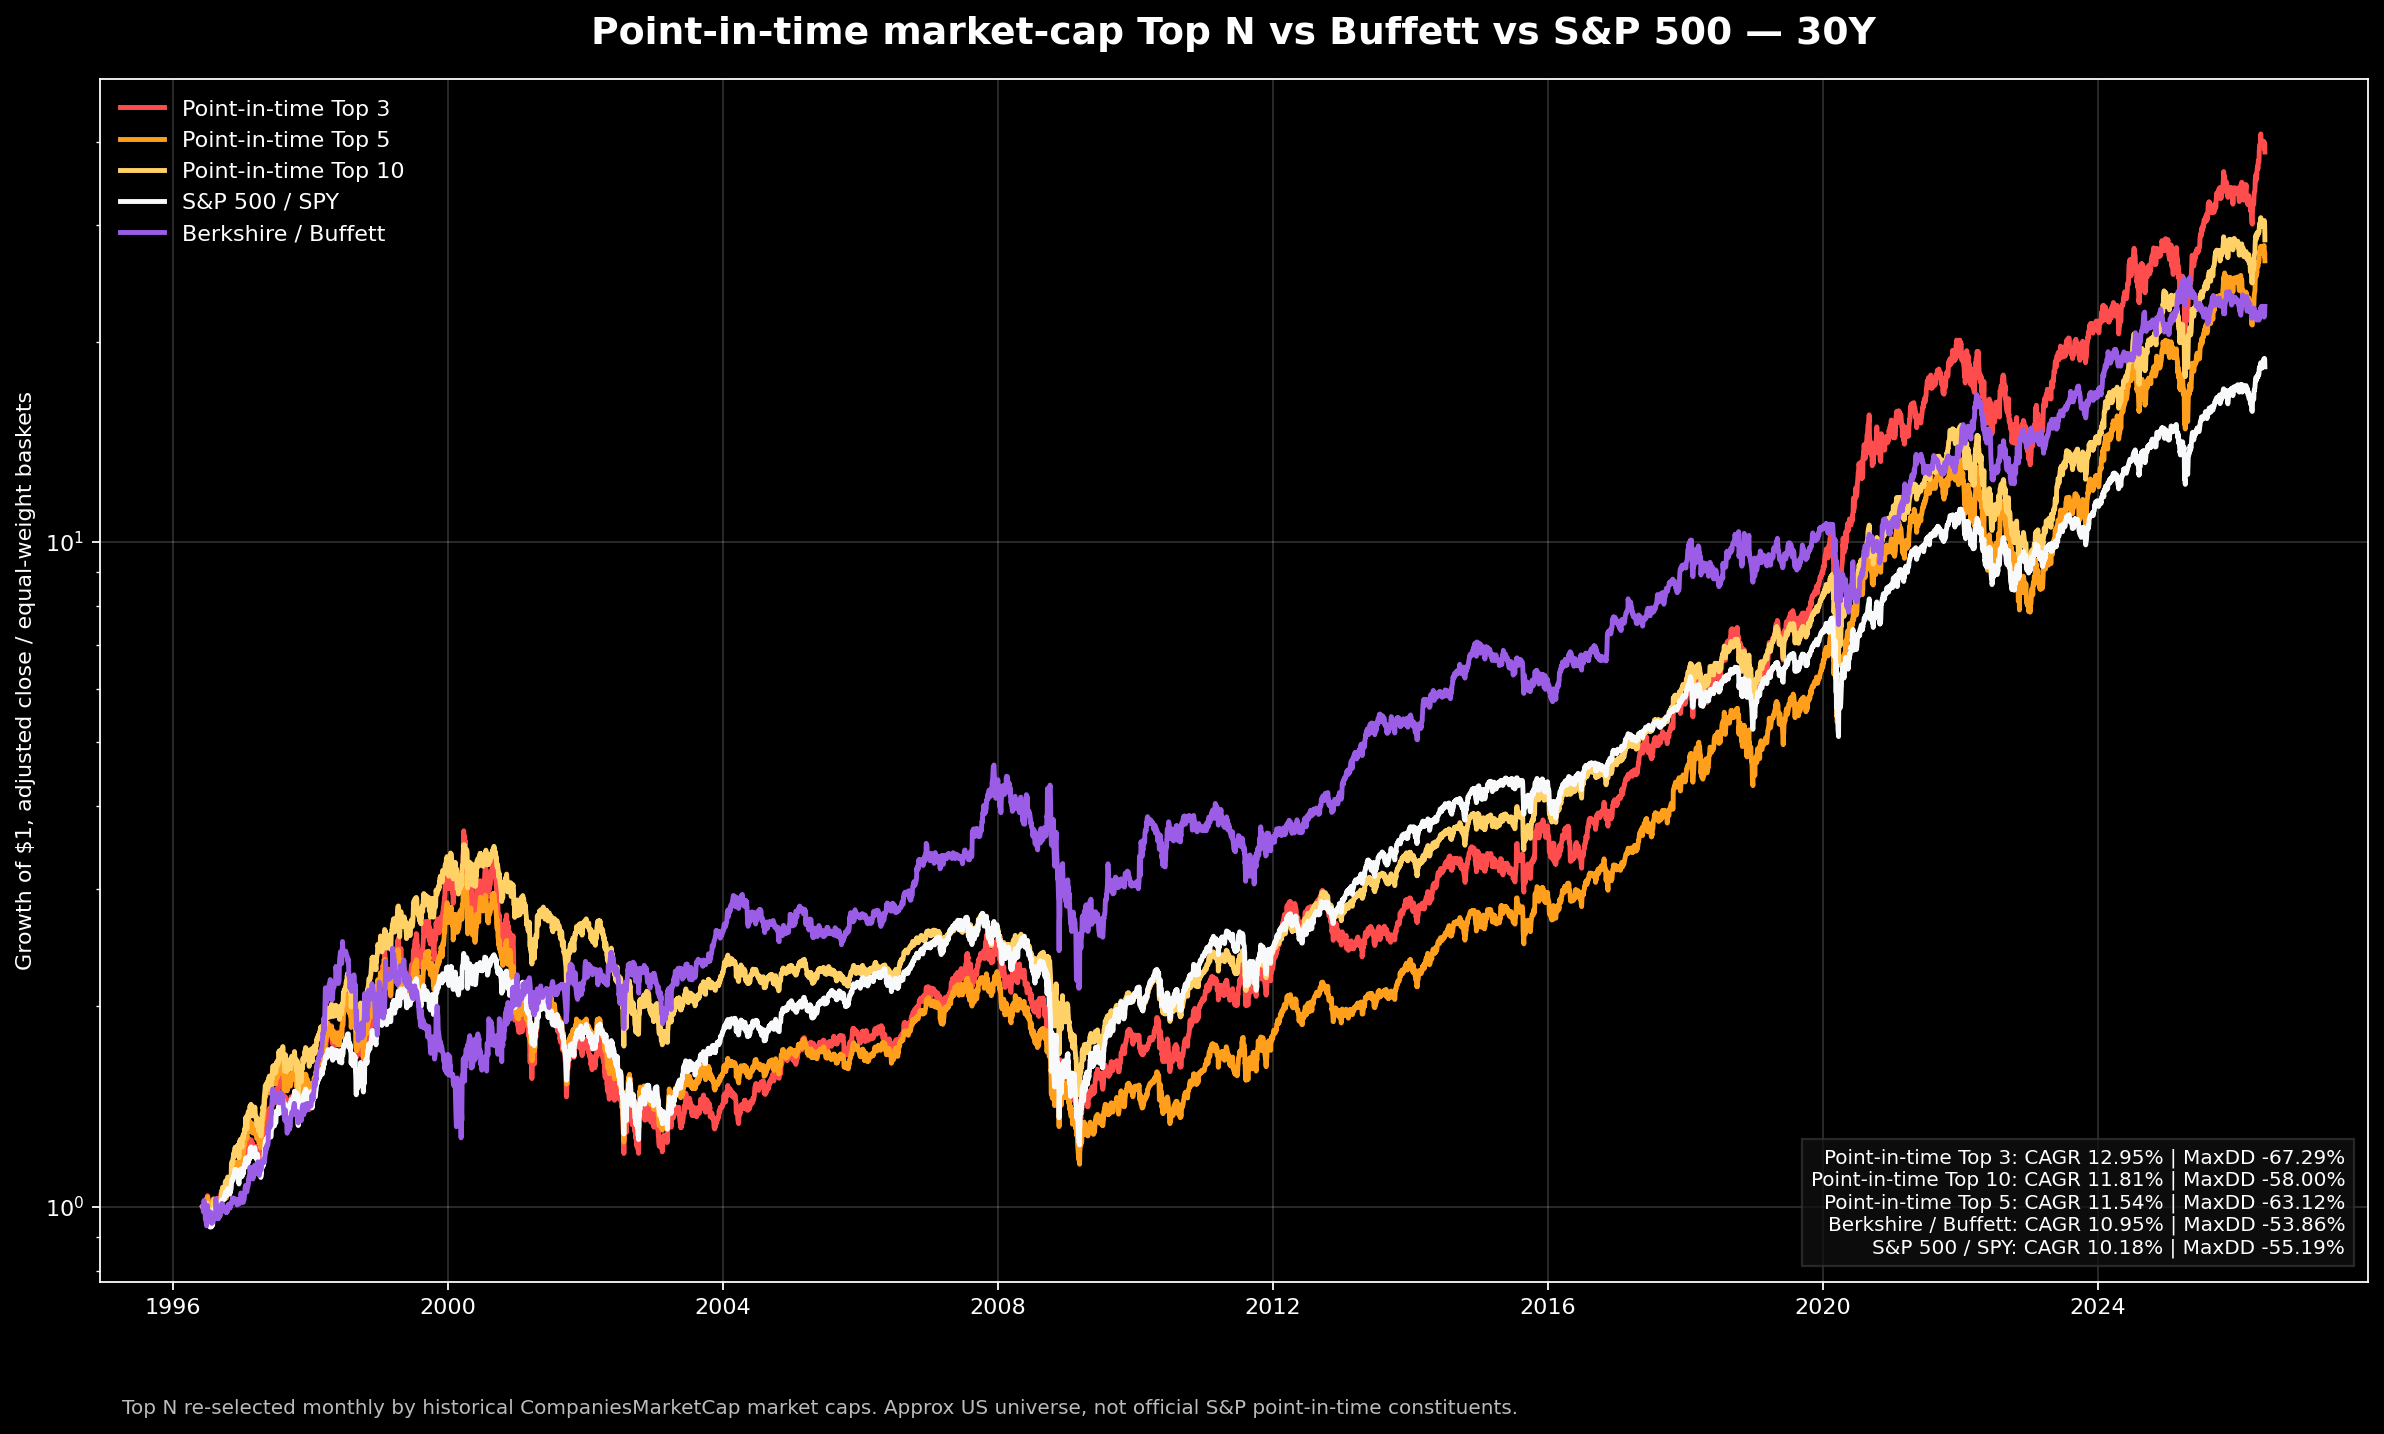
30 Years
| Basket | CAGR | Max DD |
|---|---|---|
| Top 3 | 12.95% | -67.29% |
| Top 10 | 11.81% | -58.00% |
| Top 5 | 11.54% | -63.12% |
| BRK-B | 10.95% | -53.86% |
| SPY | 10.18% | -55.19% |
The cleanest result is the 30-year window. Top 10 beat SPY by 1.63 percentage points per year. Top 3 beat SPY by 2.77 percentage points per year. That gap looks small on paper. Over 30 years, it is large.
30-Year Backtest Chart
Can You Reduce the Drawdowns?
A simple timing overlay can reduce drawdowns, but it is not the main source of return. The edge is still ownership of the dominant companies. The overlay is a survival tool.
A separate overlay test uses a basic rule on the point-in-time Top 10 basket: own the basket by default, cut exposure when the basket falls below its 200-day moving average, and add back when the basket is deeply drawn down and oversold.
Normal regime
If the basket is above its 200-day moving average, stay fully invested. If it is very overbought near highs, trim exposure to 80%.
Broken trend
If the basket is below its 200-day moving average, cut exposure to 50%. This keeps dry powder when the trend is damaged.
Panic add-back
If the basket is below the 200-day moving average, down more than 20% from its one-year high, and RSI(14) is below 40, raise exposure back to 85%.
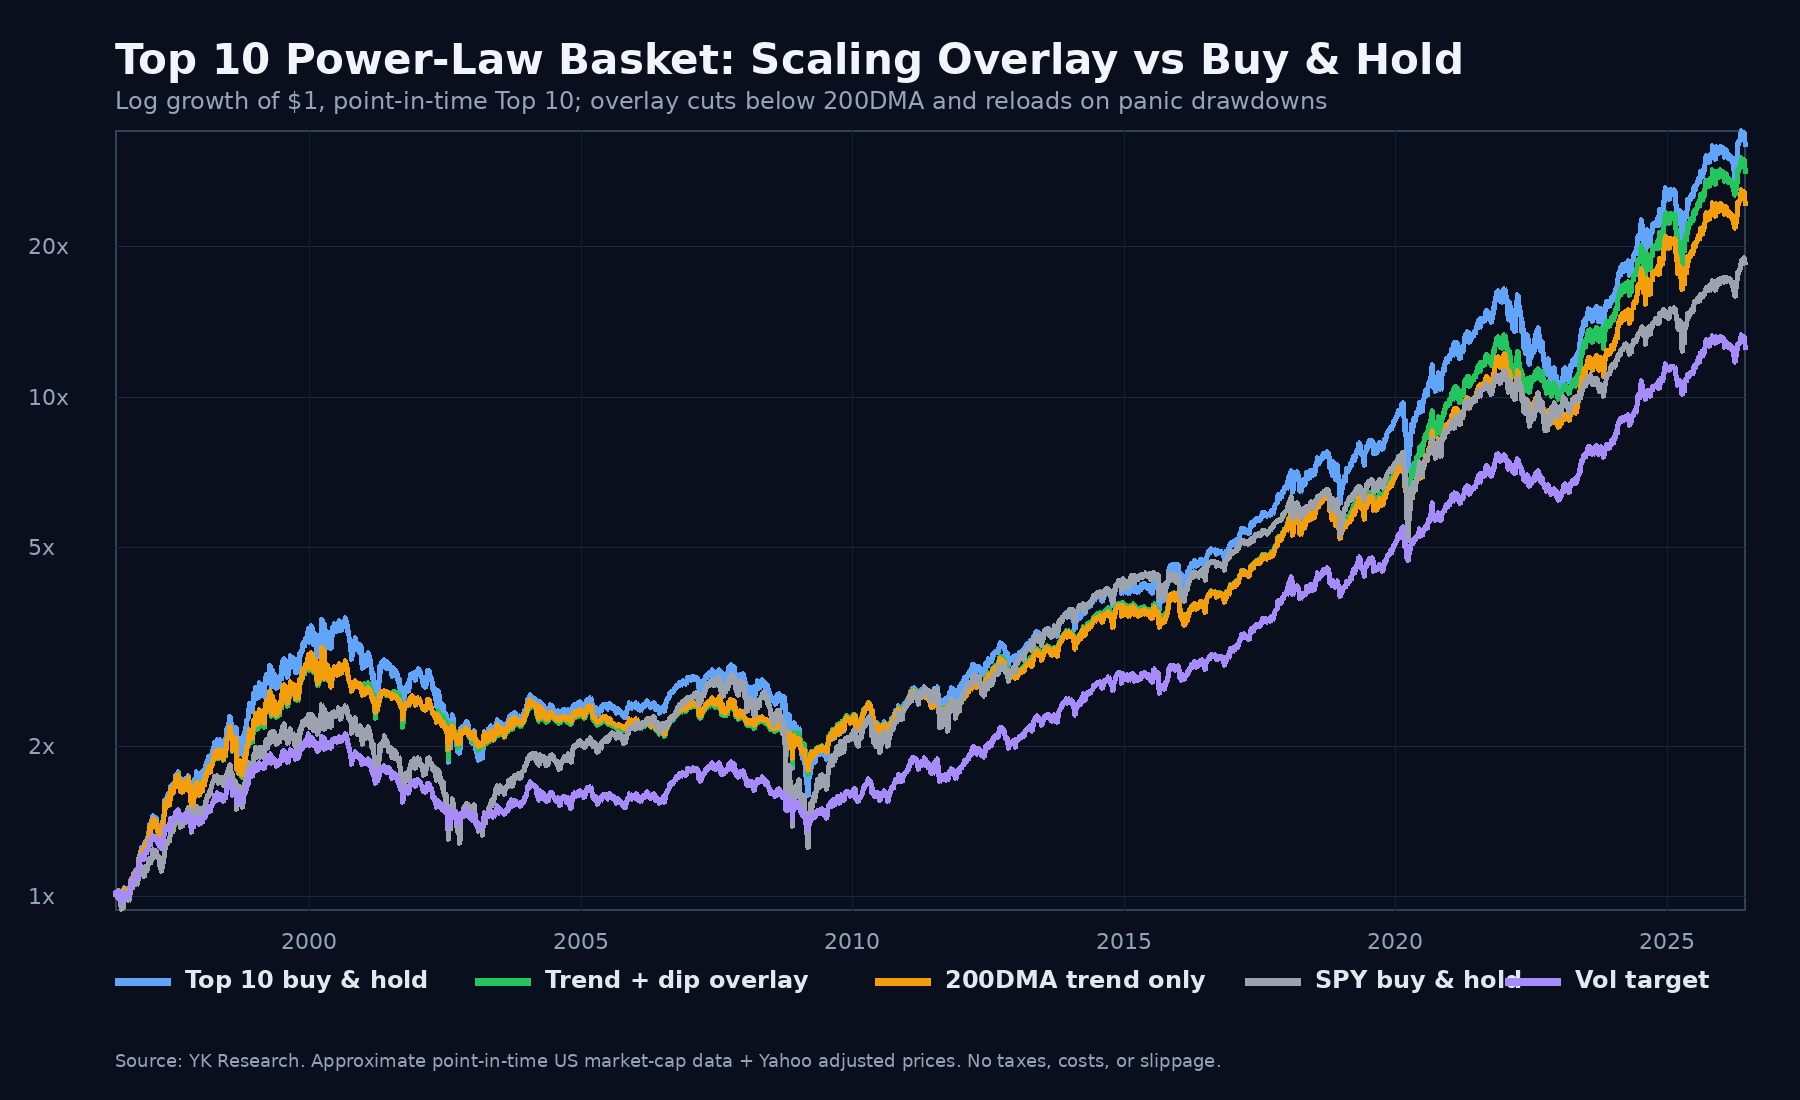
The lesson is not that timing creates the edge. The overlay usually does not beat Top 10 buy-and-hold. It gives up a little upside to make the ride easier to survive.
Theory of Edge
Why would the market pay an investor to own the largest companies? The answer is structural concentration.
Scale economies
The largest companies often buy inputs cheaper, distribute products wider, hire better talent, and amortize fixed costs across global revenue. Scale compounds into margin and resilience.
Winner-take-most markets
Software, ads, cloud, networks, semiconductors, payments, and platforms tend to reward category leaders. The leader gets data, distribution, cash flow, and optionality.
Institutional demand
Large funds need liquidity. The biggest companies can absorb large flows. Passive indexing also sends fresh capital into large weights every month.
Selection by survival
A company does not become one of the largest by accident. It usually survived prior cycles, competitors, capital markets, and execution shocks.
The market pays for owning scarce, dominant cash-flow compounders when the economy keeps rewarding scale. That is the edge. The backtest is evidence of the effect, not the reason to blindly chase it.
The Rent
Concentration charges rent. The Top 3 basket had the best return and the worst drawdown. A 67% drawdown is a forced-sale machine if the investor has leverage, redemptions, poor sizing, or weak conviction.
- Top 3 concentrates business-cycle risk.
- Top 3 concentrates valuation risk.
- Top 3 concentrates regulatory and political risk.
- Top 3 can become a hidden momentum trade near cycle peaks.
What Breaks It
The trade fails when the largest companies stop earning their size. Size can become bureaucracy. Market share can invite regulation. High multiples can turn even good companies into bad stocks.
- Leadership changes from growth platforms to cheap laggards.
- Rates rise and compress mega-cap multiples.
- Regulators attack the profit pool.
- The index becomes too crowded in one theme.
Takeaway
Broad diversification protects you from being wrong. It also dilutes your exposure to the companies that matter most.
The power-law lesson is simple: markets do not spread returns evenly. They route a large share of the gains into a small number of winners.
The process lesson is harder: if you concentrate, you need rules. You need drawdown tolerance, rebalance discipline, and a reason why the leaders should keep earning their leadership.